Text2Chart31: Instruction Tuning for Chart Generation with Automatic Feedback

1Seoul National University, 2KAIST AI, 3NAVER AI Lab,
(EMNLP 2024 Main Oral Presentation)

Text2Chart31: Instruction Tuning for Chart Generation with Automatic Feedback.

Abstract

Large language models (LLMs) have demonstrated strong capabilities across various language tasks, notably through instruction-tuning methods. However, LLMs face challenges in visualizing complex, real-world data through charts and plots. Firstly, existing datasets rarely cover a full range of chart types, such as 3D, volumetric, and gridded charts. Secondly, supervised fine-tuning methods do not fully leverage the intricate relationships within rich datasets, including text, code, and figures. To address these challenges, we propose a hierarchical pipeline and a new dataset for chart generation. Our dataset, Text2Chart31, includes 31 unique plot types referring to the Matplotlib library, with 11.1K tuples of descriptions, code, data tables, and plots. Moreover, we introduce a reinforcement learning-based instruction tuning technique for chart generation tasks without requiring human feedback. Our experiments show that this approach significantly enhances the model performance, enabling smaller models to outperform larger open-source models and be comparable to state-of-the-art proprietary models in data visualization tasks.

Text2Chart31 Dataset

We develop a hierarchical plot generation pipeline leveraging GPT-3.5-turbo and GPT-4. Our newly contributed Text2Chart31 dataset supports 31 plot types based on Matplotlib with 11.1K data points. We outline its key characteristics in Table 1, comparing it with existing datasets in the data visualization domain.

The Text2Chart31 dataset D consists of 11,128 data points, each of which contains a tuple of (x, c, d, r, y): a textual plot description (x), its corresponding code (c), and the resulting plots (y).

For 8,166 data points, we additionally include a raw data table (d) and intermediate reasoning steps (r) to generate descriptions.

Table 1 comparing key characteristics of the Text2Chart31 dataset

Task Definition

Our benchmark is designed to evaluate three tasks:

  1. Description-to-Chart: Given a plot description x, an algorithm generates its corresponding code c that creates a chart using the Matplotlib library1 Hunter, 2007.
  2. Raw Data-to-Chart: When provided with only a raw data table d, the algorithm generates intermediate reasoning steps r that analyze the raw data and then generates a description d for the most suitable plot type based on the characteristics of the data.
  3. Code-to-Description: Given the code c for a plot, the model generates a detailed description x of the plot.

Method

Our proposed algorithm is as below:

Experiments

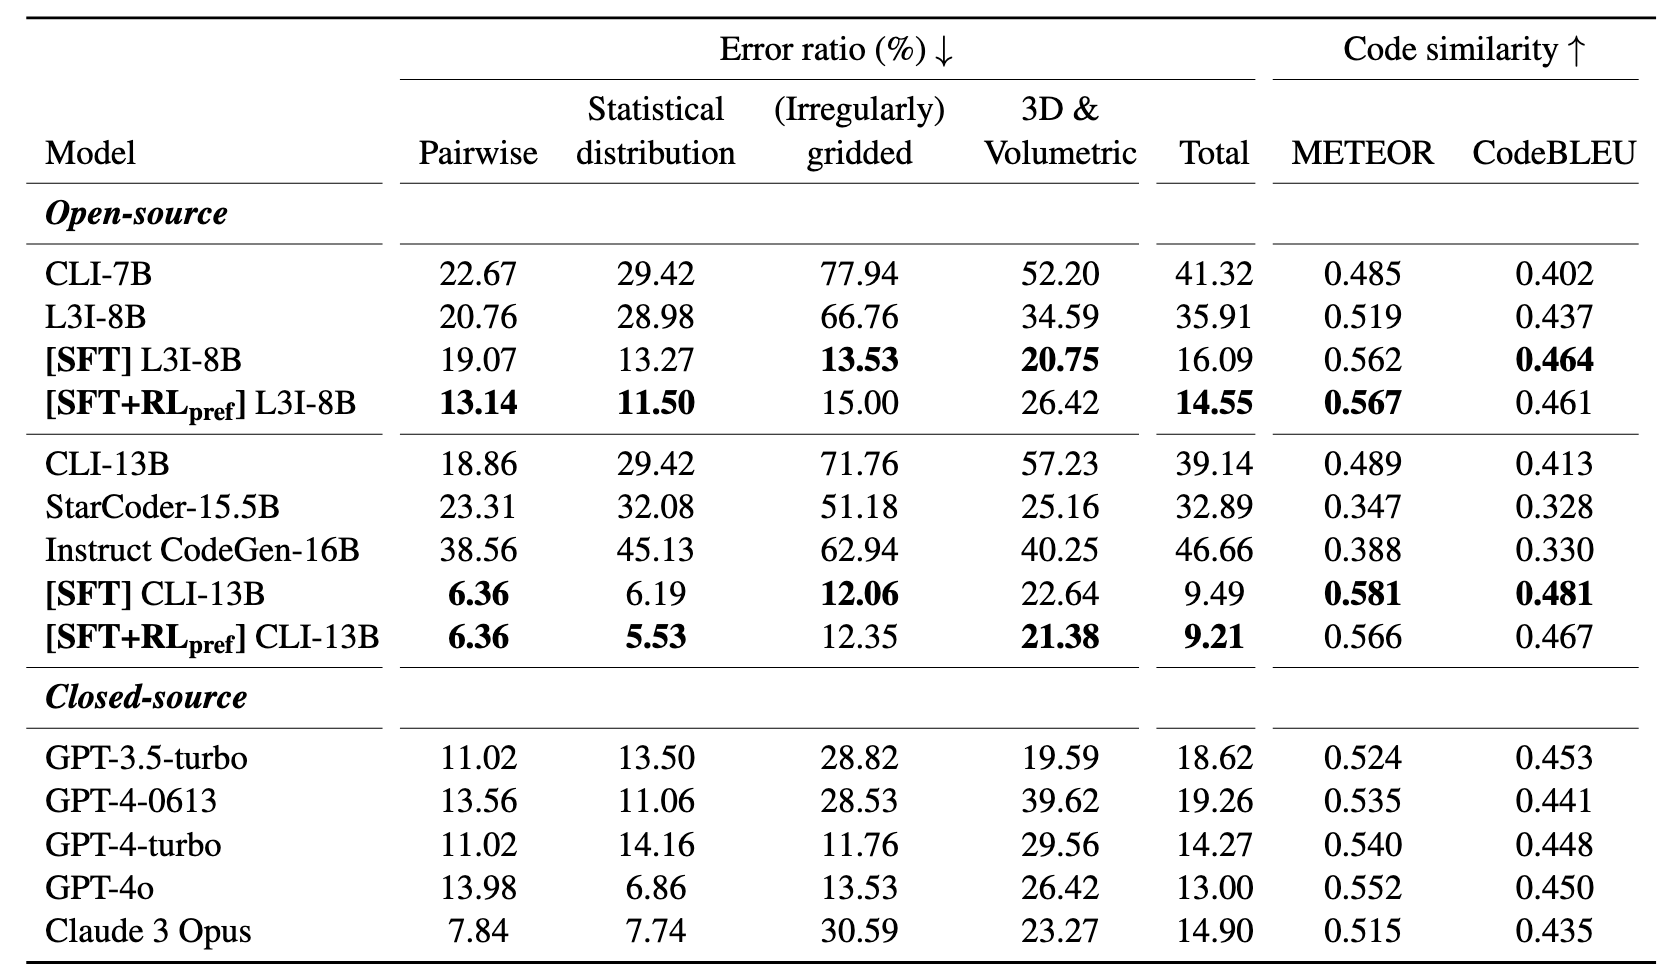
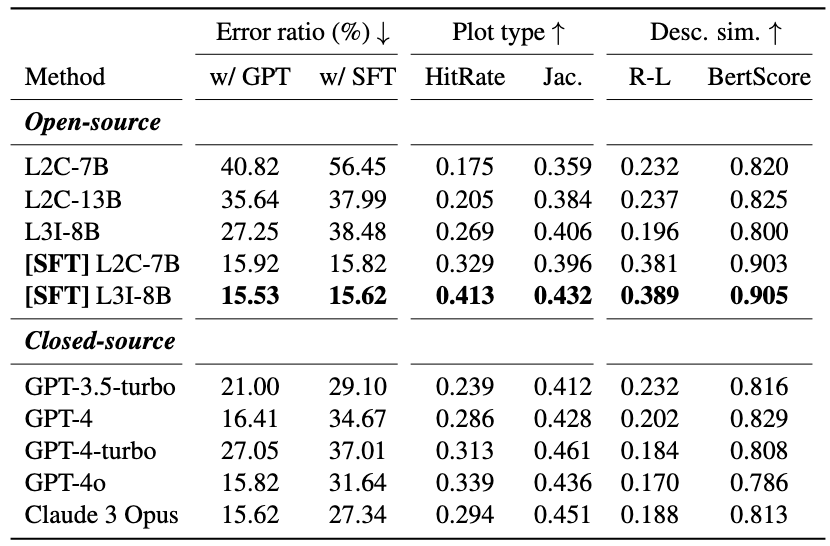
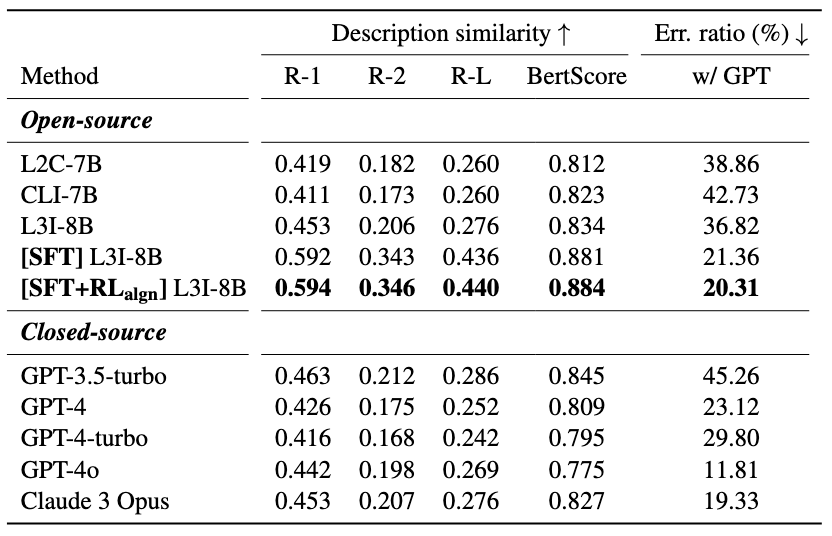
Our results demonstrate that our method outperforms state-of-the-art (SOTA) models.

Experiment 1 Results
Experiment 2 Results
Experiment 3 Results

BibTeX


        @inproceedings{pesaranzadeh2024text2chart31,
          title = “Text2Chart31: Instruction Tuning for Chart Generation with Automatic Feedback”,
          author = "Pesaran zadeh, Fatemeh  and Kim, Juyeon  and Kim, Jin-Hwa and Kim, Gunhee",
          booktitle = "Proceedings of the 2024 Conference on Empirical Methods in Natural Language Processing",
          year = "2024”,
      }
  
Template of this post is based on Nerfies website.